Creating Superhydrophobic Membranes

Howdy!

This week was pretty interesting because I was able to see all of the electrospun fibers we created last week with using the scanning electron microscope (SEM). I was also able to practice  my students will use to measure the contact angle of a drop of water on an object to test its level of hydrophobicity.

If you recall from my earlier blogs, we want to create membrane that is superhydrophobic. According to all of the background research, superhydrophobic surfaces have a a high water contact angle above 150° and a low water roll off angle below 10°.

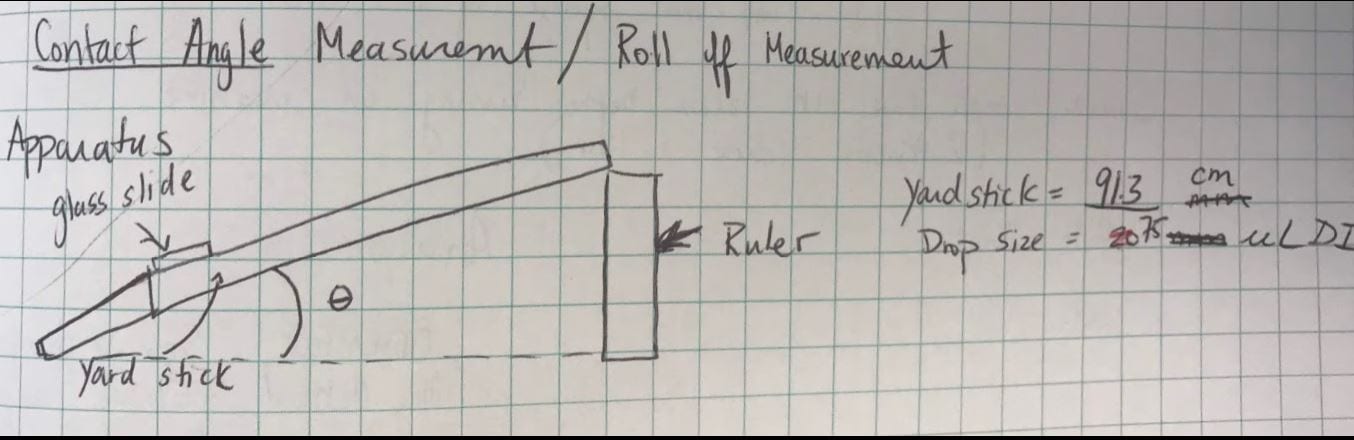
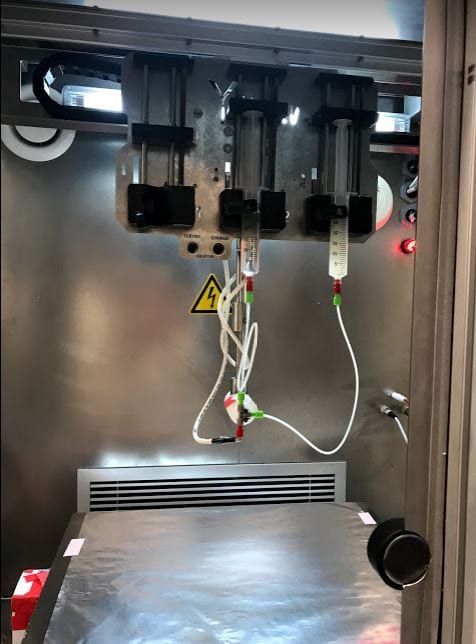
I didn’t take a picture of our set up, so I’ll explain it. It’s something that can be modified easily and done in class. We taped a glass slide to a yard stick and then mounted our membrane sample with double sided tape. We then dropped 75µL of water on the membrane. Next, we very slowly raised our meter stick against the wall . We measured the height we raised the ruler up the wall when the drop of water rolled off the sample. We used trigonometry to figure out the roll off angel, but if you have protractors you could have your students measure the angle directly. Here is our set up to test roll off angle.

Diagram of our apparatus to test the roll off angle
A drop of water on our 6:12 PVDF: PVP membrane sample

RollOffTest-1g7ae0t

After testing roll off angle, we were able to use the drop shape analyzer, which allowed us to take a precise measurement of the contact angle between a drop of water and our membrane. Here you can really see the different wetting properties of the two membranes.

Contact angle of 136° on PVDF:PVP in a 6:12 ratio
Contact angle of 43° and 59° on PVDF:PVP in a 9:9 ratio

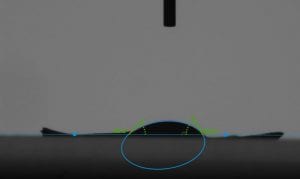
This is also something I can do with my students. I would have them take a picture of their drop of water and then after uploading it into an image editor they can  measure and label their contact angles.

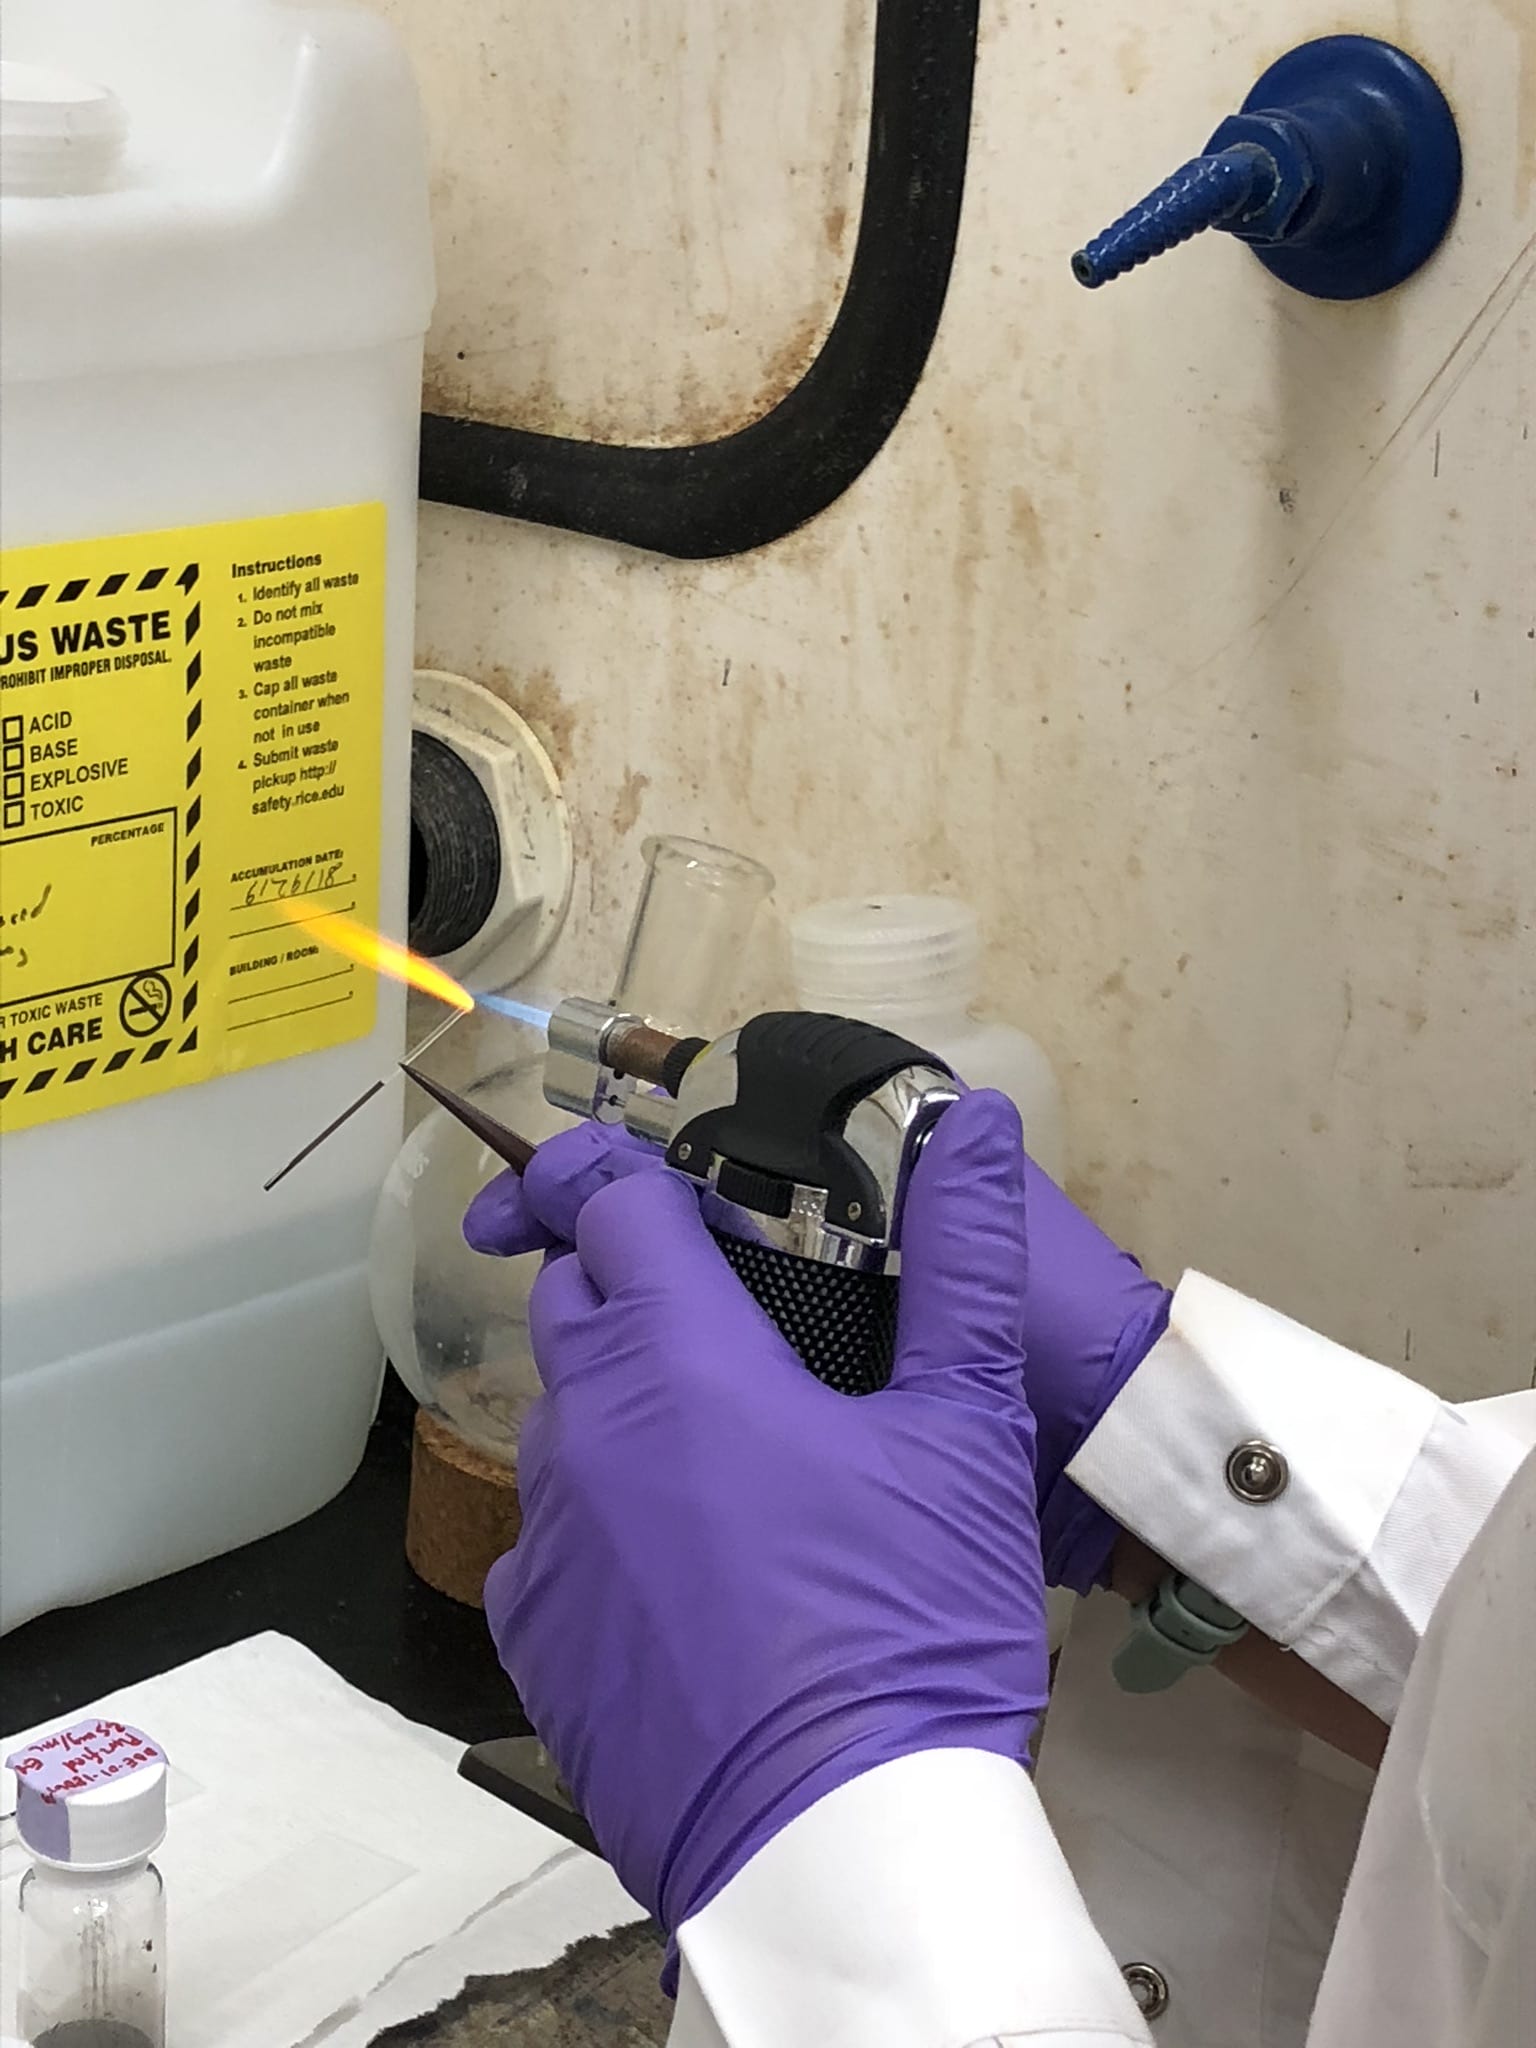
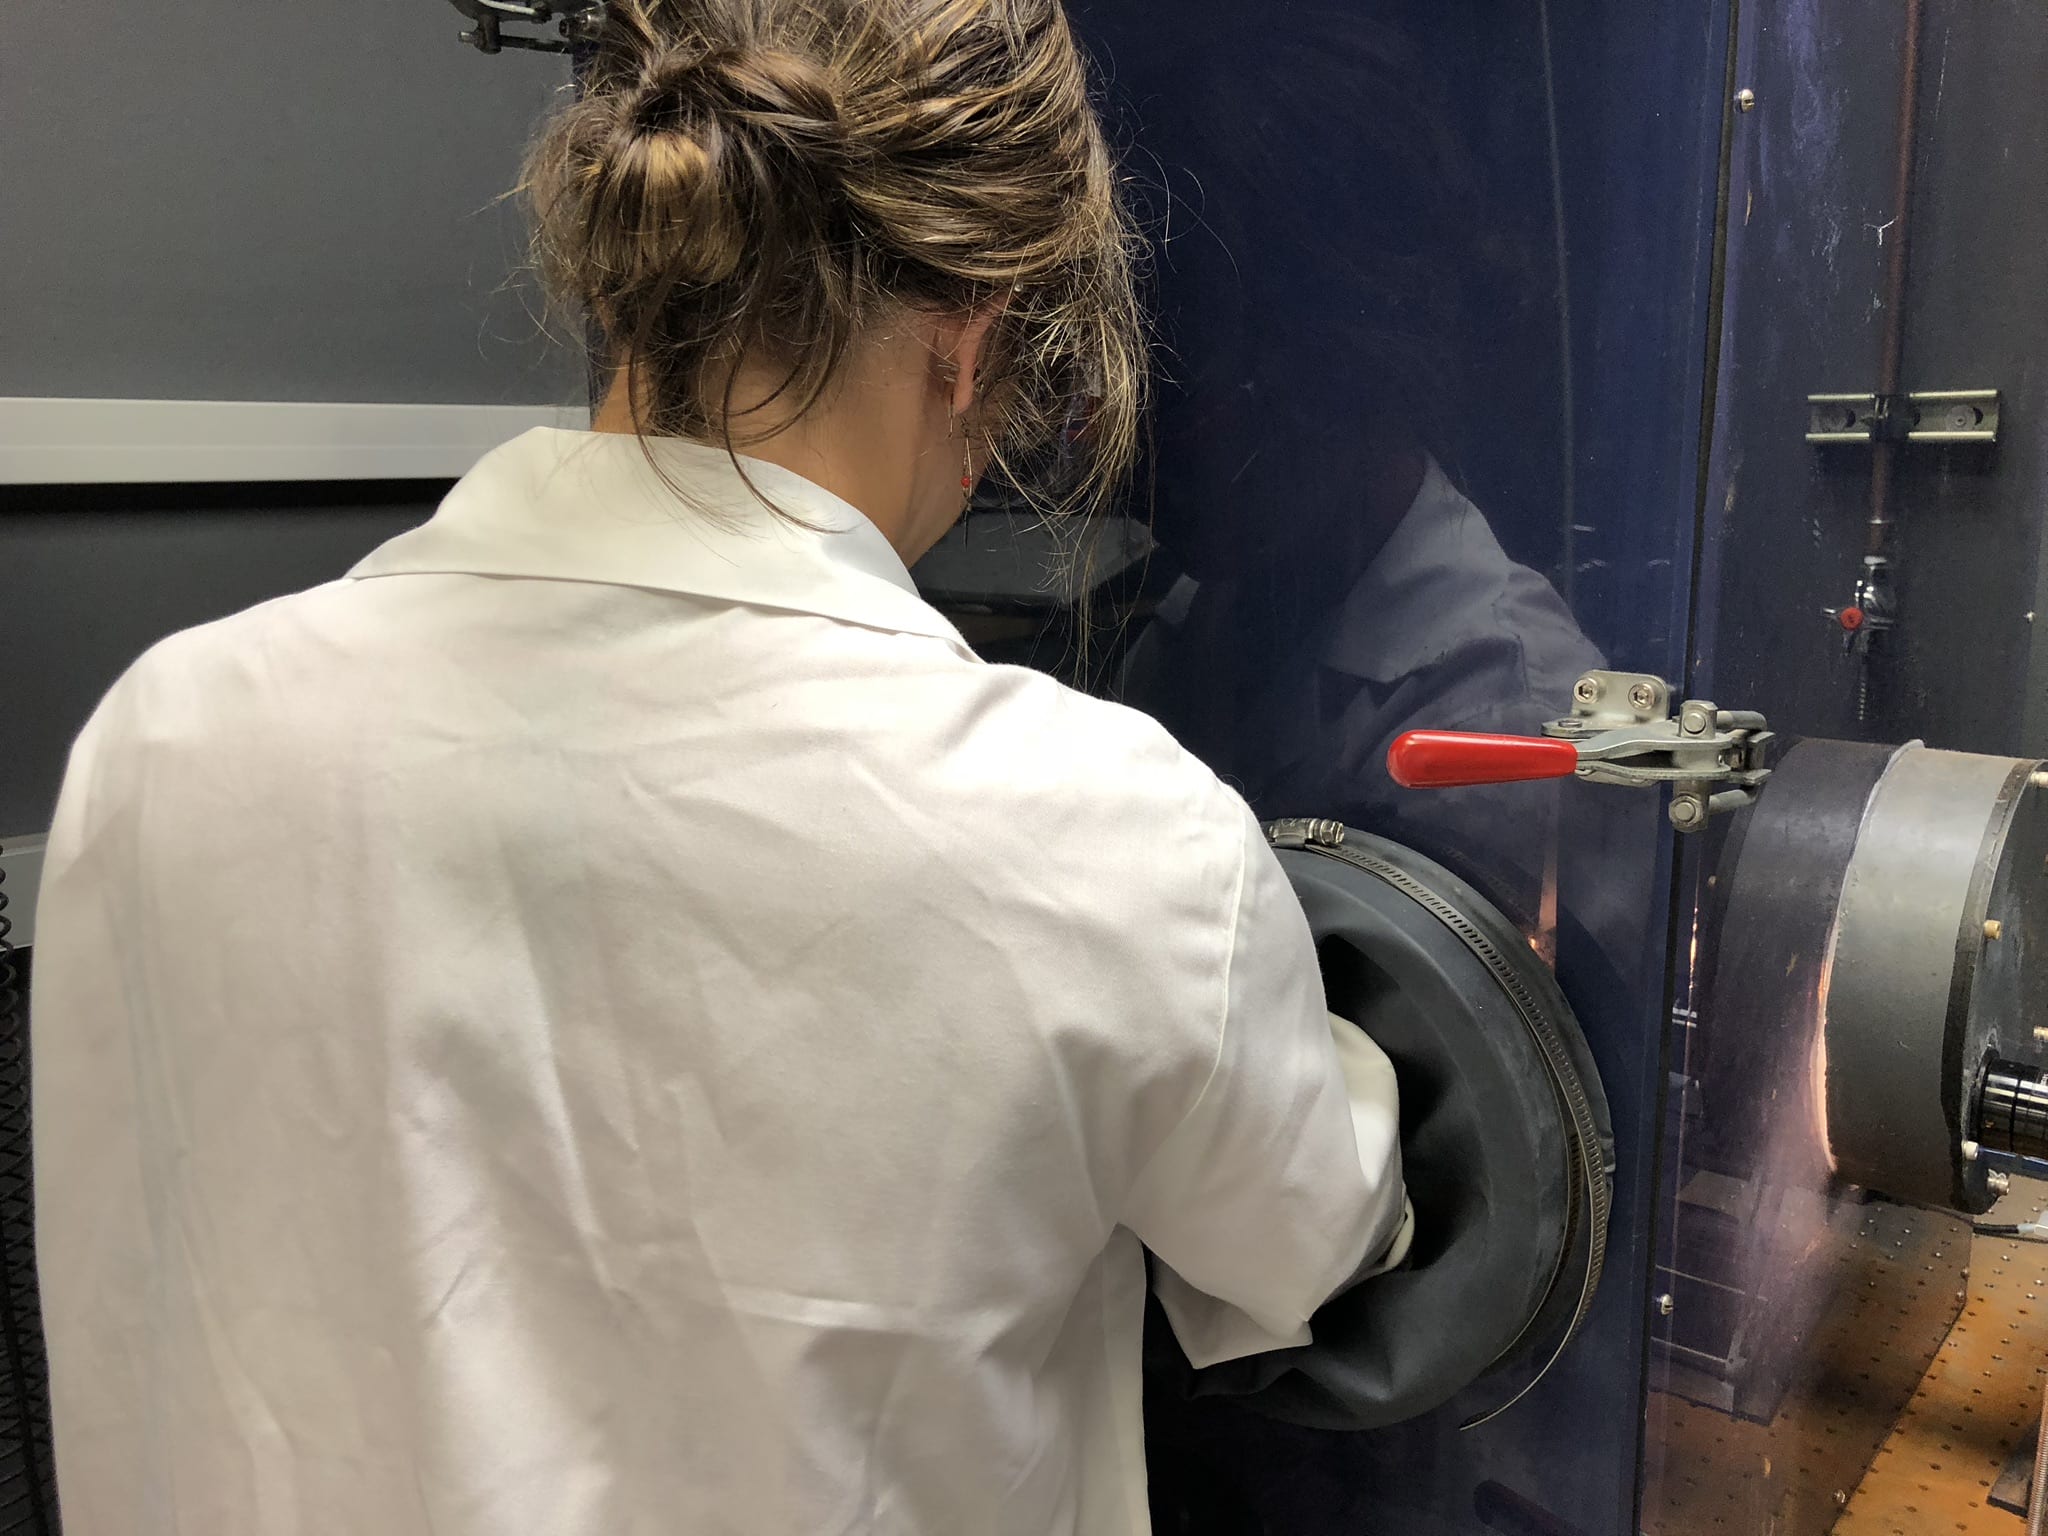
Next, we took our samples to the SEM to look at the surface morphology.

Rough texture on the membrane fibers will make the membrane hydrophobic
Image of 18:0 PVDF:PVP showing texture on fibers and some beads with texture
6:12 PVDF:PVP showing beads with pores
Uniform beads throughout 6:12 PVDF:PVP membrane


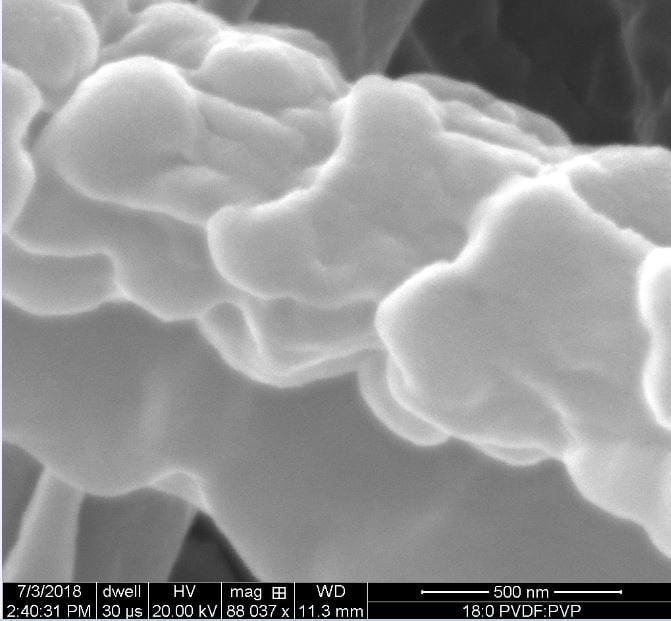
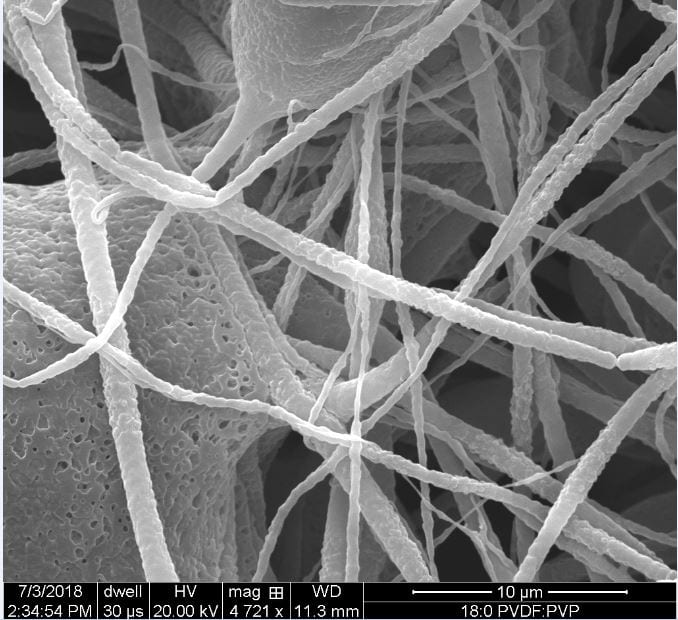
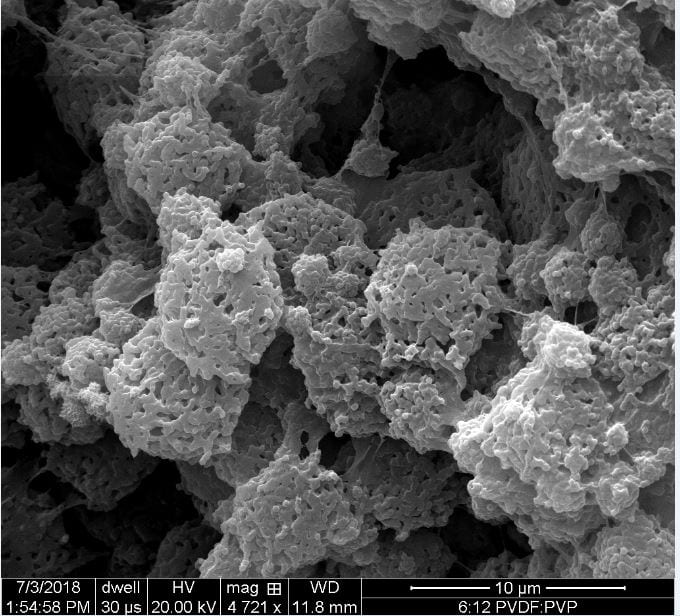
Overall our our membrane with only PVDF and our membrane with 6:12 PVDF: PVP had the highest contact angle. The PVDF only membrane had no roll off angle and the drop of water adhered to the membrane, but the 6:12 had our lowest roll off data.

Based on our data, we decided to blend our best membranes. We will spin fibers that have 18:0 PVDF:PVP inner core and an 6:12 PVDF:PVP outer shell.

Our current electrospinning setup with two solutions


Next steps include adding silver nanoparticles to the membrane to add roughness and then coating the membrane with a chemical to lower the surface energy. So I will update you then.

Until next time…


Week 4 in the CNT Lab

This week I’ve gotten to see and do a lot of new things. Since we finally had some purified carbon nanotubes (CNTs), we put them in  chlorsulfonic acid to dissolve the CNTs. The result is a viscous black liquid that we can then analyze.

We then used some of the dissolved nanotubes to make a sample in capillary tubes to be analyzed with Polarized Optical Microscopy (POM), To make the sample, you have to draw up some of the liquid into a tiny glass tube. Then you have to use a blowtorch to melt both ends of the tube. The POM was being finicky, so we didn’t actually get to observe the samples.

We then used an extensional rheometry technique that was developed in the Pasquali lab to determine the aspect ratio of our CNTs. There are two pistons in a glove box that are really close to each other. You take a drop of the dissolved CNTs and place it between the pistons. You record video of the CNTs pulling apart. Here’s what the Pasquali group paper says about the extensional rheometry: “The method is based on measuring the extensional viscosity of CNT solutions in chlorosulfonic acid with a customized capillary thinning rheometer and determining CNT aspect ratio from the theoretical relation between extensional viscosity and aspect ratio in semidilute solutions of rigid rods.” I’m still trying to figure out what that means…


And we have virus!

I can’t believe we only have two weeks left! The time has definitely gone by really fast!

This week was focused on figuring out if we actually made virus. The actual process takes a lot of time because we started making this during my first week and its now the 4th week. To do this we had to do a separation process and qPCR. I was very nervous because its not until the qPCR that we are able to see how much virus we actually made (also proves that we have been working with something for the past 3 weeks). Last week before our harvesting of cells we knew our cells had some virus in them since they also had the GFP gene (glowing cells). After harvesting it was time to lyse the cells and separate the virus from everything else (cell debris, cells DNA, RNA, etc). This process is done using Iodixonal tubes. You must layer the tubes using different concentrations of Iodixonal solution and after ultracentrifuging them, the virus concentrates itself in the 40% layer.

The process of layering the tubes was stressful because you start with the 15% and work your way to the higher percentages. Since you want to make sure you have clear layers you must go at a speed of 1ml per 10 seconds—- very very slow…After the layering and centrifuging, you must insert a needle on the top of the tube to let air out and a needle at the 40% layer to remove the virus. This was also very tough because you have to be careful not to go through and when removing the virus you also need to be careful to not absorb the white band above the 40% layer because that is more cell debris (you don’t want that). When this is done you are left with about 3ml of solution that has your virus– well, you are still not sure how much virus you have so qPCR is next.

For qPCR you must clean everything with bleach because you want to prevent your sample from being contaminated. We had to clean our sample a bit using NaOH and HCl, and some heat and then we put it in our wells. This process takes a bit of time because you have to be careful to micropipette just what you need. Some of the solutions you have to use are viscous and drops stick to the tip. You have to always pay attention and white any excess off because having an extra microliter can affect your reading. After micropipetting everything into the wells, these are taken to the qPCR machine which does all the work and gives you a lot of data after two and a half hours. 

And….. the qPCR machine told us that we actually made 1.58E11 viral genomes per ml. My mentor said that this was a good result and our next step is to clean the sample further so it can then be used for Transduction. After 4 weeks of work I am so glad that we got some virus and it will be used for the research the lab is doing.

Chemistry Boogaloo Week 4: MALDI Madness

Howdy!

Man, this week really flew by! Just as I’m starting to get the hang of things, this whole experience is about to be over. This week, we did quite a bit of testing of our boronic acid mixtures that we set up last week. We’ve been trying to mix up some stuff that’s going to be good for layering onto our surfaces, but testing has revealed that a large portion of our mixtures haven’t worked out. Here’s where the MALDI machine comes in. MALDI stands for matrix-assisted laser desorption/ionization. It’s basically a gentle way of fragmenting our peptides that would be harder to read by more conventional methods.

This is an example of a MALDI machine. The one in the BRC is quite a bit bigger! We also have a speed MALDI, which essentially just gets it’s results quicker.

Maldi Prep

First, you have to prep your samples to put onto the MALDI plate. These samples have been mixed with a matrix which helps the samples crystallize onto the plate.

MALDI plate

Each one of those bubbles represents a single sample. You can run many experiments using one MALDI plate, which makes them ideal for the kind of testing that we’ve been doing.

Once the samples have been read, we get data that looks like this. You can see the different fragments of whatever was on the plate and their molecular weights displayed at the peaks. We can tell if our compound has modified by how heavy the tallest peaks are.

Hopefully next week we can test out our newly modified surfaces and get some more data!

Bon Jovi and lots of data fill my head! Week 4

Hold up! Week 4? Already? Wowza – so much to do, so little time!

I know this is supposed to be a summary of week 4, but I’m going to squeeze a bit of last week into this blog starting with the Round Robin tours. The labs were amazing! I enjoyed seeing them all  – the flies, the pooter tubes, the nanotubes, the weird smells, the crazy warning signs – it was all fascinating! Here are a few pictures that I’m allowed to publish:

At the end of last week, I meet with Ryan Bare of HARC, Houston Area Research Council. He was kind enough to sit and talk with me at their Woodlands office for over an hour! He answered so many of my questions relating to my research with Dr. Masciello and the water chemistry of Buffalo Bayou and beyond. Per our request, HARC sent us historical data collected from a number of sites along the bayous where we are also collecting water samples.

This week, with the help of Loredana Suciu here in the Earth, Environmental, and Planetary Sciences department, I’ve been able to put together data in charts and graphs that will support my research story for my poster presentation. Loredana is a master at Excel and disaggregating raw data, and it was a super helpful experience to learn from her how to take research results and put it into information to use for the symposium.

I’m trying not to panic but instead take small steps while remembering to breathe! Each time I sit down to work on my abstract, I have this overwhelming need to get my poster finished. I have to remember that there is still work to be done and it’s impossible to have all of my data and conclusions ready at this point. I finally made a rough outline of my poster so my mind can at least calm down a little bit.

Getting it down on paper…

This week, I attended another summer luncheon presentation for the undergraduate students in the Earth, Environmental, and Planetary Sciences Department. Eric Barefoot was this week’s guest speaker. We talked about the importance of getting involved in research as an undergraduate student, the obstacles and challenges those students face, as well as the benefits of starting early– even if they feel unsure about the subject. Just ” jump in and learn as you go” was the message. I can totally relate to this because I know I started the RET experience feeling unsure of the academic language everyone was using around me, but it didn’t matter. I’ve kept going, Googled a ton, asked lots of questions, floundered, percolated on a ton of data in my head, and ultimately learned that I am more knowledgeable than I’ve given myself credit for.

This Friday, Solana and I will go and collect more samples from White Oak and Buffalo Bayou, but this time we will be 100% on our own! Dr. Torres and Dr. Masciello will both be out of town. Although I’ll miss them, I’m looking forward to sampling again with just Solana. We will be fine, and I feel so trusted!

Before I go, I wanted to give a big shout to my fellow RET teachers:

  1. Mariana – Thanks for sending me all that data! What I’ve learned from Loredana this week and what you sent me has helped me know more about drawing conclusions and supporting them with graphs from data in an Excel spreadsheet.
  2. Chinyere – Thanks for the helpful poster making tips! Sharing your previous RET experience was greatly appreciated.

I hope everyone has a Happy 4th of July!

—Melanie 


Week 3

Week 3 was different given the round robin tours. My flies have yet to eclose so I could not begin my experiment. I did end up doing a trial run of the 4 genotypes my mentor has chosen for me.

Emergence trial run:

To test the intelligence of fruit flies we construct arenas that the flies will emerge into from pipette tips when it feels like it is ready to. This is what an arena with a pipette tip looks like:

To get the flies into the pipette tip we use something called a “pooter tube” mine is the one with the orange tape. we place the pipette tip with netting on the end of the pooter tube and suck up 1 fly:

The fly is put into the arena and we time how long it takes to “emerge”. For the most part we watch the flies for 5 hours.

The round robin tours were awesome, I was so glad to see other labs and to see what is going on with the other interns. My lab is very different from everyone else’s and it was eye opening. Thank you guys!

Week 3 Polymers

We are kind of stuck in our experimentation so I will update you guys more on this for the next post.

As for the tours, they were really fun and interesting to see other teacher’s experiences.  Last year, I was in BRC for my research so it was nice to go back to that building.  I’m even more interested to see what lessons will come out of this research! I love the curriculum portion of our internship project.  I attached some pics of that day 🙂


This weekend I tried to make polymer bouncy balls but failed and instead got globs. lol  So, it will be interesting to see how I change the lesson up so that I do get bouncy balls.  That way, students can test their products in different ways.  I used 50% glue/water solution and 4% borax solution based on a write up I read online. I used clear elmer’s glue and orange food coloring. I will be trying other ways to try to make the bouncy balls.  If the bouncy balls don’t work out too well then I could make this a different lesson focusing on making “Gak” or “slime”  This is very interesting because it’s exactly how I feel my research is going. We are making samples of our polymers but trying to find the best one for our project.

If you leave the polymers out long then they would take the shape of the flat surface. You would probably have to hold it in a ball to retain shape.
My lesson plan assistant helping me make the polymers at home.

Formation

We went though diversity training this week.  As always, I was disappointed in that diversity was seen as an option and not a requirement.  I understand that from a pedagogical and social point of view it was necessary.  We as teachers have to start where the students, the public, the audience is, and the reality is that diversity is seen as a convenience and not a necessity.  They have not seen that limits on what a person can be based on if they were born with white parents are social constructs, not inherent to the person.

For example, one African American acquaintance told me that when he was a teacher he knew that the hispanics would be ok as they tended to be construction workers, and that the best bet for many others to make it is sport, so he tried to help them succeed in that way.  As my Hispanic relatives were doctors, surgeons, architects, teachers, pharmacists, and my neighbors or many skin colors were not athletes, but professors, lawyers, a wide range of professionals, I tended to disagree with him.

So I do think of diversity as a necessary condition for success, not an option.  I think the science agrees with me as well.  As we are doing medical research this week, I will focus on that.

We are working in the Scalable Health lab on a devices that may be able to collect and interpret the photoplethysmogram(PPG) in such a way to diagnose or predict medical outcomes. One issue that effect the collection of data is the quantity of melanin in the skin.  If there were only light skin participants, we might develop a machine that only worked on light skinned people, and it might go to market.  It reminds me of the time when most cardiovascular researchers and participants were men, This lead to results were the presentation of cardiac events in women were not well understood.  This may be happening in autism research now, where it is possible girls are are not receiving appropriate interventions as they are not being diagnosed, because we assume they present identically to boys.

As a science teacher, I take it as a directed and funded mandate to increase the diversity of the researchers in the world.  I find talent to be independent of any of the physical characteristics that so defined who has opportunity and who does not in this country.  It is not a just my opinion that diversity in research in critical.  I think as science teachers we need to take this challenge seriously. It is up to us to show some coordination in maximizing opportunity so that all who might do research have equal opportunity.

Smarter than a computer?

Not by much… however, this week I did learn how to give command line instructions to a Python program.

You know all those options that your programmer friends seemed to  have memorized and leave you thinking how in the world do they know all of those?
Well, now I can create a program that can change its execution based on the command line parameters you feed it.  I am the master, only took me a week to get there, but I am fairly happy with the fact I can do it!

The Mystery of the Missing Bacteria

First, thank you everyone who took the time to read my last blog post about the activity I designed for my biology class. I really appreciate all of the support and feedback! While last week, I focused on how to get my students into the engineering process, this week I will talk about how I got a taste of the engineering process through my research. Attend the tale of the mysterious vanishing bacteria.

Once upon a time, there was a lab at Rice university using viruses to eliminate harmful bacteria. Every day they would work to test how well these viruses could eliminate bacteria, but never had they imagined they would have to figure out how to grow more bacteria. That is, until the week of June 25th, 2018 when a mystery struck the lab. Dun dun dun! *cue lightning and spooky sound effects*

Normally, when we plate bacteria and our phages in order to count the colonies, we mix planktonic bacteria (meaning, bacteria growing in liquid medium) with the phages and soft agar and then pour it on the plates. In doing so, we get a nice bacterial lawn with a few clear plaques forming where the viruses infect and lyse the bacteria. However, for about the past week and a half this was not going as planned. Rather than forming a bacterial lawn, the bacteria was growing in skinny swirls at best and at worst, it was not growing at all! What could possibly be happening to our bacteria? Well, turning to our handy dandy engineering and design method helped us figure it out.

Each day, we would try adjusting our procedure slightly to see if it would help the bacteria grow.
Define the problem: Bacteria are not growing
Brainstorm Solutions: Maybe we are putting too high of a concentration of viruses, so the bacteria are unable to grow a lawn due to high rates of infection?
Test Our Solution: Adjust the procedure by diluting our viruses 100x
Evaluate Our Solution: Hmm…bacteria still aren’t growing….
Iterate: Let’s try diluting the viruses 1000x and 10000x
Test Our Solution: Still no bacteria…
Brainstorm Solutions: Maybe it’s the temperature of the agar when we pour the bacteria in? If it’s too hot, that would kill the bacteria.
Iterate: Wait longer for the soft agar liquid to cool before adding the bacteria (and fail at this a couple times due to waiting too long and the agar hardening in the tube, sigh.)
Test Our Solution: Still no bacteria… (cries inwardly)
Brainstorm Solutions: Maybe it’s not the temperature of the agar, but the nutrients in the agar? The bacteria is growing just fine in the liquid media, why don’t we try adding some of that media to our agar?
Test Our Solution (crossing our fingers): SUCCESS!! The agar needed more nutrients (see images below). We will have to be sure to add the liquid media any time we are plating this type of bacteria.


Communicate Our Solution: Be sure to label all bottles of soft agar appropriately and only use the ones with media added. Tell labmates that this is the new procedure so that they don’t fall into the same mistake.

Case closed! The mystery of the missing bacteria has been solved all with the help of some engineering.

While going through the engineering process again, and again, and again can feel a bit frustrating sometimes, at the end of the day, figuring out what went wrong and how to fix it was incredibly rewarding. Sometimes in science we forget how much engineering we actually do. Even if it’s not building a device to use, we design and redesign our methods constantly using the engineering design process. I feel even more confident than ever in guiding my students through the engineering process and all of the frustrations and successes that come with it.