We got to see some cool things today! Great job group A! Here are some pictures. Zach has the rest and I’m sure he will be posting the rest soon.


We got to see some cool things today! Great job group A! Here are some pictures. Zach has the rest and I’m sure he will be posting the rest soon.
Meeting with project mentors. Presentation of GUI
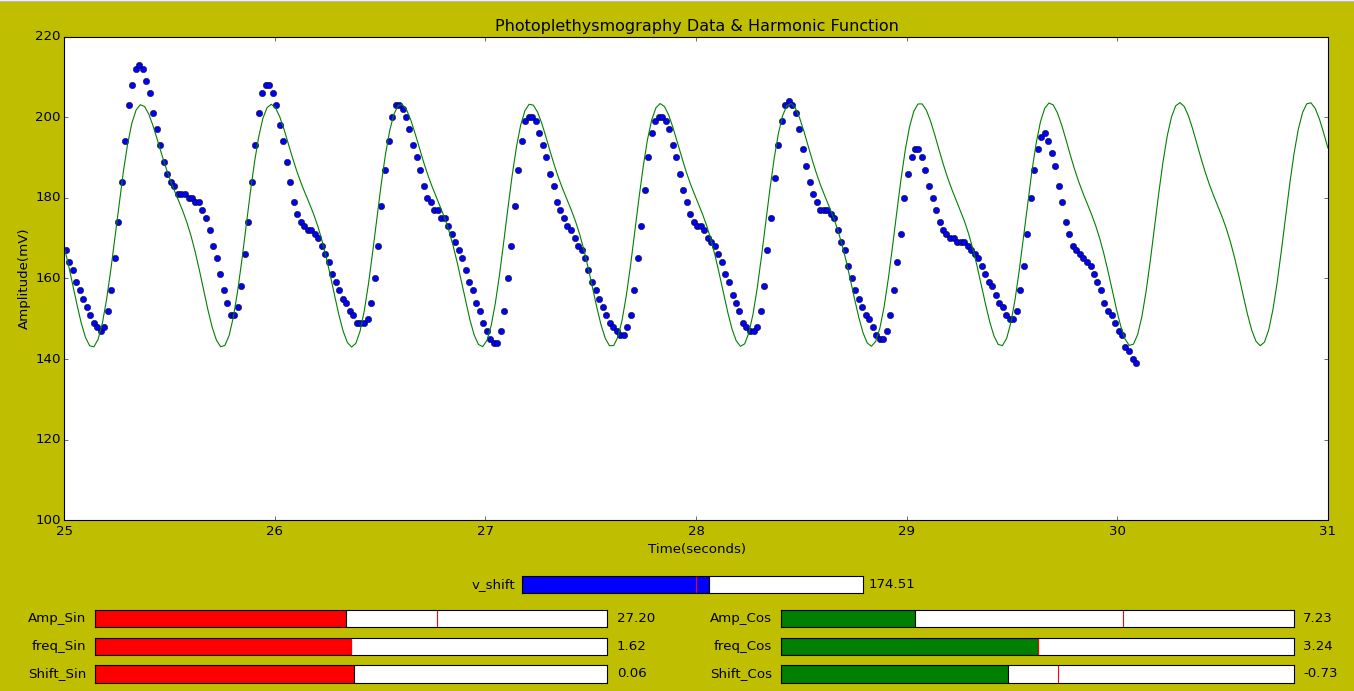
Version 1.0 of Graphic User Interface ready. Written in Python 2.7.10
GUI PPG data – Harmonic Function-1ko0fme
Capabilities:
This GUI produces a good match for low noise PPG data
Started with the R programming and will be trying to use it to get the data interpretation of the different factors in PPG signal measured under different conditions.
We also had good discussions on what the week with students will look like.
Really happy to be a part of such a wonderful team.
There was failure in the synthesis of the polymers at the beginning of the week but after Wednesday things started to work better!
My mentor uses Python for calculations and graphs. So, I think that would be an interesting thing to look into in the future when learning coding. This week I created an excel WS for calculations instead of hand calculating everything. I made a mistake in my hand calculations which took some time away in lab.


Failures and Successes
Photopolymerization
Wednesday afternoon and on


About over a week ago, we also had a group meeting where a person in the research group, an undergrad, gave a short safety talk. I think it was very important so that people know where everything is. For example, you should know where the eyewash station is without having to look for it in case of an emergency. I plan to use this in my classroom during the 1st week of school when going over safety. Safety is important all the time anywhere. 🙂
Last week was the first time I was able to participate in field work with Dr. Masicello and Solana. The three of us met early at 7:00am on campus to grab all the gear and head out the bayous so we could collect water samples.
Our first stop was along Buffalo Bayou under a bridge. We parked near a very nice restaurant that sits on the bayou and walked quite a ways down to get to the water. Passing by the restaurant and all of the beautiful landscape was a bit eye-opening for me. I’ve lived in Houston a long time and thought of Buffalo Bayou as a historic but not so nice body of water that happens to run through downtown. Thanks to the work of the Buffalo Bayou Partnership, much of the Bayou is now rather nice. Miles of paved walkways, lots of landscaping, beautiful art pieces here and there, restaurants… we even passed a couple having what looked to be there engagement pictures taken with the bayou in the background.
Anyway, we made our way off the beaten path more than once to collect samples. We followed this same procedure each time: First, we collected a sample in a large plastic bottle. We followed the chemist’s ritual and washed out the bottle three times before filling it fully with our sample. We then placed a multiparameter in the flow of the bayou and waited several minutes. The meter measured key parameters including pH, ORP (oxidizing reducing potential), conductivity, dissolved oxygen, turbidity, ammonium, chloride, nitrate, and temperature. After writing down our exact GPS location and noting the measurements from the meter in our handy-dandy notebook (Blue’s Clues reference for you 90’s kids), we headed back to the car where we prepared samples by pushing the water through 0.2-micron filters. We all took turns using a caulk gun to push the water through the syringe, pass the filter, and into the collection bottles. It’s tricky to put just the right amount of pressure on the syringe so the water will pass through the filter, otherwise, the filter goes flying off! The caulk gun was a lifesaver.


^^^^ Cool video of the two bayous merging together!
We followed this process at four different locations. On our second stop under a bridge near Allen’s Landing, we were approached by two security guys driving in a golf cart. They first asked us what we were doing and after we explained, they regretfully informed us that it was a good possibility that a dead body could be floating by any minute! Say what?! Sadly, a person had fallen in upstream near a dog park and drown. Knowing this tidbit of info made the rest of our sample collection interesting, to say the least. At one point, we all were on heightened alert because we could see something large and black which stuck slightly up out of the water floating our way. Of course, my mind when to a clothed body and that was the shirt I was seeing sticking up. Upon closer inspection, it turned out to be a large cushion-like pillow – whew!
The samples we collected were put in an ice chest and were brought back to the lab in the Keith-Weiss building. Solana will prepare the samples further and place them into several different machines which you will get to see this week on the round robin lab rotation. One machine will test for ion chromatography, chloride, phosphate, nitrate, and sulfate. Another machine with test levels of metals. The final machine will test for the isotopic signature of the water (meaning we can tell where the water actually came from – was it from the northwest or northeast regions of America or even Canada?).
I’m looking forward seeing everyone this week in our round-robin tour!
——Melanie
This was a week of hands-on, independent work. My mentor showed me how to do everything last week and left me to my own devices. The week started off really well. I started by using a scanning electron microscope (with lots of help); the images you can capture are amazing, though not magnified enough to see individual carbon nanotubes (CNTs).
I then worked on purifying a sample of CNTs — first through an acid wash and then a water wash. Later in the week, I learned how to purify the sample even more by burning off amorphous carbon in a furnace.
I also spent a lot of time analyzing Raman data and looking at TGA data. I’m finally beginning to understand what all the graphs and charts mean!
I did accidentally break a slide when trying to find the CNTs on the Raman microscope. I felt really silly and anxious about it. The folks in the lab made me feel better though. And, I got to experience a little anxiety about learning something new — which put me in the place of my students. So, a good experience all around.
Hello everyone! Last week I briefly mentioned an activity that I had in mind for part of my maker challenge lesson plan. I promised that I would go more in depth the next week , so I have dedicated this post to explaining my natural selection of viruses activity. I have included the background and outline of the activity so that you can have an overview before looking at the activity itself.
Imagine jumping into the perfect pool on a hot summer’s day. The water is cool, crisp and clear thanks to a filter that helps to keep it clean. Now, imagine jumping into the worst pool. It’s probably green, grimey, and gross. That grimey gunk that lines the sides of the pool is known as a biofilm. Biofilms are layers of bacteria or algae that grow on surfaces, and they form in lots of places: pools, shower tiles, and even your teeth! Biofilms also tend to form on water filters, so if you don’t replace the filters regularly, bacteria can leak into your pool or even the water you drink! But, what if we could remove this biofilm without needing to replace the filter or releasing toxic chemicals into the water? Scientists have found a seemingly unlikely hero in viruses. Just like there are viruses that infect us and make us sick, there are some viruses that specifically infect bacteria. These viruses have specific structures on their surface that help them attach to the bacteria. Some even have special abilities to kill bacteria even faster using special enzymes. The problem is that there is more than one type of bacteria in these biofilms, and viruses are usually very specific to one type of bacteria. Scientists need a way to engineer viruses so that they can infect and kill as many different bacteria as possible. That’s when you come in!
In this activity, students will experience how some scientists are using the principles of natural selection to engineer viruses that infect multiple bacterial hosts. By sequentially changing the environment through switching out the type of bacteria, over the course of a few generations, scientists are left with viruses that can infect all of the different bacterial hosts. This model will help students visualize natural selection as well as the process of viral infection.

First, you will need to attach the surface proteins to the viruses as outlined below:

For this demonstration you will be walking your students through the process of introducing your viruses to different bacterial environments. An outline of these different environments and the expected outcomes is shown below:


Thank you for taking the time to read my lesson idea! Any and all comments/advice is much appreciated!
The goal this week was to make more nano-silver laced membranes, react them with sulfur, and destructively test coupons to see how fast the sulfur-modified silver nano-particles leach. So, just like that one team playing for the world cup (yes, that one), I was close but missed my goal. I also had an unexpected set of data and a you-should-have-listened moment.
In week one I created a membrane and we sent off coupons to see how consistent the silver nano particle concentration was across the surface. We got the data back. We found a large (200%) difference between the center and the edge of the membrane. Well that changes things. I had observed while creating the membranes that sometimes during the agitation, the center of the coupon had a very thin amount of solution above it. So I modified the process to have a slightly deeper well of reactants (25mL instead of 20mL – with mentor permission). Maybe the center and corner coupons will be closer now. To make sure, I cut our 8 coupons (4 corner and 4 center) and we will test those. That took 24 hours.


I needed to make many more membranes, especially if the silver loading varies. How many? 8 coupons per membrane, with 5 different sulfur concentrations, with 6-8 timed leaching samples, and possibly 2-3 coupons per reading – that’s a lot of membranes. So I started Monday after the RET meetings. And the first membranes – failed. I should have listened. Previously someone mentioned that they thought one of the chemicals (NaBH4) had failed the day after they made the solution. The solution I used was even older. I should have listened. Do over on Tuesday.
Tuesday I created a fresh solution of NaBH4 and created 10 membranes. That took all day. The picture above was membrane #3 or 10.
I then cut out 40 coupons.
I then created the sulfidation chemicals – lots of stoichiometry, solubility, molarity, and -ty’s.
I then reacted everything which took another 24 hours. Note the black speckled lines on the coupons – that’s the silver sulfide. The picture is 16 of the 40 coupons.

So Tuesday this next week I will be doing the leaching. I will have to bring cookies for the mass spec person who will analyze the dozens of samples.
Then we decide what to do next.
Richard Daines
Well, the rain shut down our solar experiments, but it couldn’t stop progress!
Before we could start decomposing urea using solar energy, he had to test the idea small scale. We made a stock solution of urea (artificial urine). From the stock solution, we made a sample of urea and carbon nanoparticles.
Since we did not have the sun to rely on, we decided to use an infrared laser instead. We set up a distillation column, so that any steam could condense in a different flask. Shining the laser on one section of the solution immediately created steam! Every few minutes, we collected a sample from the solution (even though we created steam, it would condense before leaving the flask). Twelve minutes with a laser heated up the flask to the point I could barely hold it!

We tested each sample for ammonia using the assay kit from the week before. The samples were compared to distilled water and the stock urea solution. All of our samples had more ammonia than the controls! The system works!

The second week of my research was similar to my first week, only I did the protocols by myself. On Monday I attended a professional development for my district. It was in Brazos Bend Park, sadly I did not hike but instead listened to lessons plans that could not be applied to my classroom. I would have preferred to be in my lab!
Last week I started my first set of crosses. It did not go as planned, because we over estimated how my male flies we were going to need of one genotype. I ended up making half the crosses I needed. Fast forward to this week, I took my first set of crosses and transferred the mothers since I was testing maternal effects. I then poured the males into the fly morgue since I no longer needed them.

The next day in the lab I needed to “clear” the racks I needed. My mentor picked four of the best genotypes for my research. To clear I would take the fly vial and dump the flies into the clear vessel. This would give me virgin flies in the morning.

I was very happy with my first batch of crosses that were made, here a picture of one of my healthy fly vials

Here are my crosses for the first and second week…


I used a device called a fly pad that pushes CO2 out of the pad and gun. This is were I count flies and separate males and females.

I have not started the actual research yet, but I am hoping I will this coming week!