
Meeting with project mentors. Presentation of GUI
Version 1.0 of Graphic User Interface ready. Written in Python 2.7.10
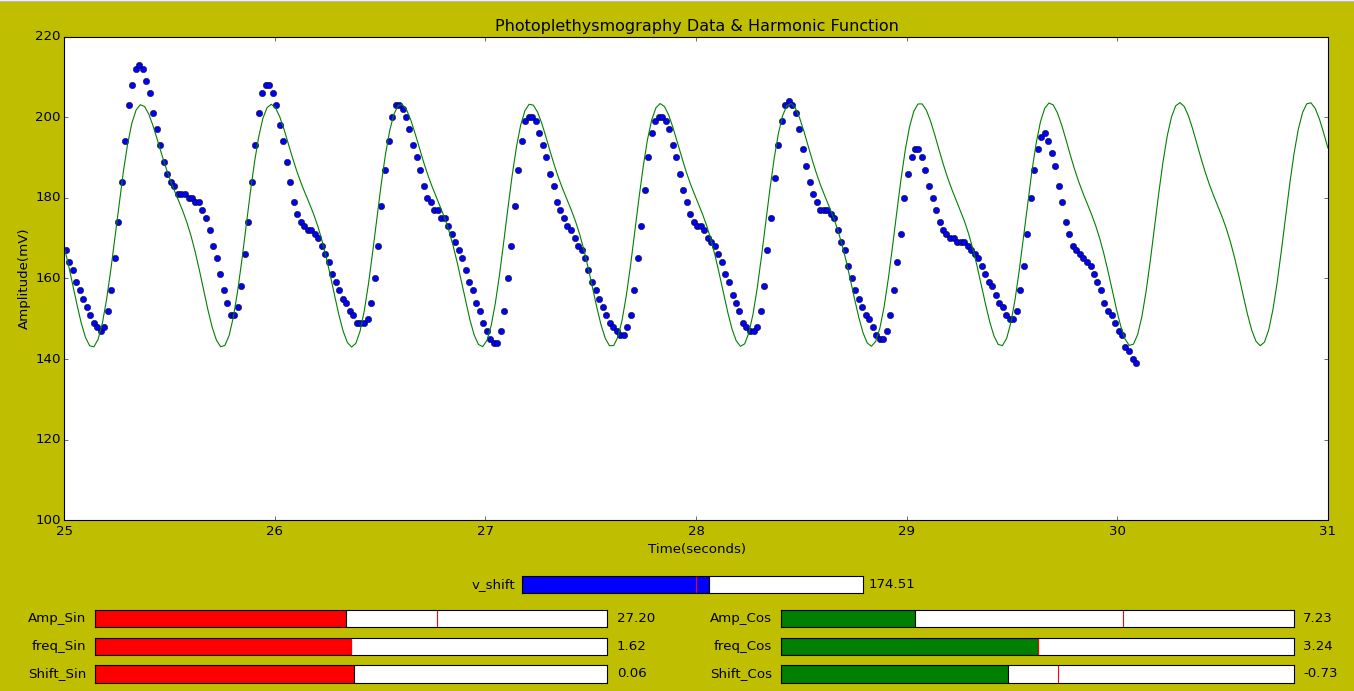
GUI PPG data – Harmonic Function-1ko0fme
Capabilities:
- Reads PPG data from a csv file
- Analyze data to determine: data average amplitude, data average vertical shift, maximums and minimums, and average frequency of the data
- Generates an harmonic function using a linear combination of Sine and Cosine: f(t) = A sin(2*pi*w1 +c) + B cos(2*pi*w2+d)
- Makes a first fit of the harmonic function to the data
- Displays a graph with the PPG data and the fitted harmonic function
- Sliders on the graphing window allow to modify the amplitudes A, B, the frequencies w1, w2, the horizontal shifts c, d, to have a better fit of the PPG data points and the harmonic function
This GUI produces a good match for low noise PPG data
That looks very cool! One of the grad students in my lab also works with Python. I think he is working on a program that can calculate cell count using pictures. My software knowledge is very poor so I think its very cool to see how you can create programs that can facilitate and do many things.